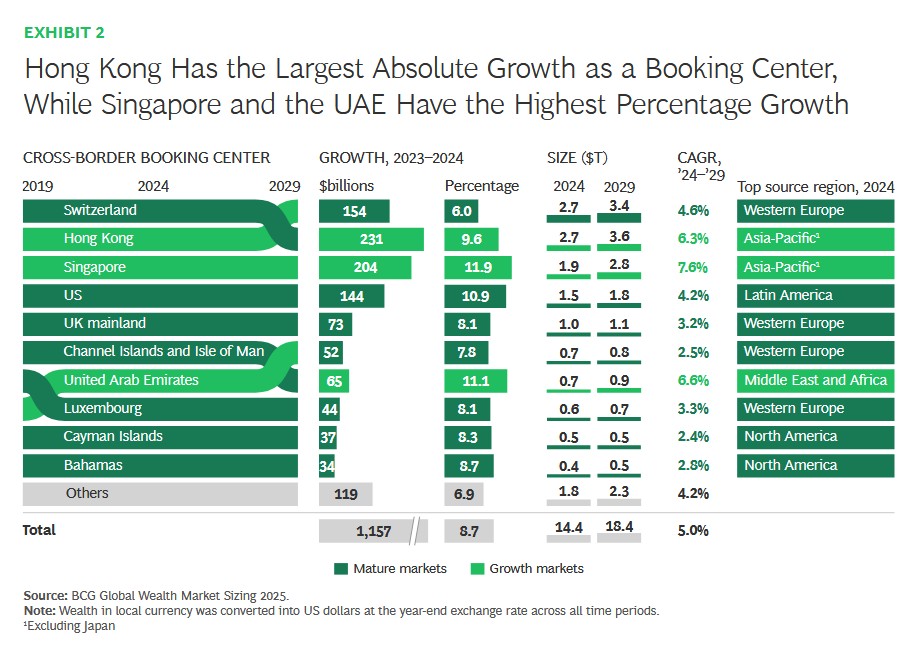
Cross-border wealth sitting in international financial centres – sometimes dubbed “offshore” – rose by 8.7 per cent in 2024 from a year earlier, accelerating from the prior four-year average pace of 6.3 per cent, according to .
The three largest booking centres – Switzerland, Singapore and Hong Kong – grabbed more than half of all new cross-border wealth. Several mid-sized hubs such as the UAE showed strong momentum. In the UK, however, growth was slower.
(Editor’s note: The impact of tax hikes in the UK and the end of the resident non-domicile system may also affect future figures.)
Singapore led all centres with 11.9 per cent growth, driven by strong net inflows from China, India, and across Southeast Asian markets. The United Arab Emirates, the US, and Hong Kong also featured strongly. The data appeared in BCG's Global Wealth Report 2025: Rethinking The Rules For Growth.
Switzerland posted moderate 6.0 per cent growth, caused primarily by market performance rather than net inflows.
Source: Boston Consulting Group
The data underpins why such centres continue to attract an influx of wealth managers, private banks, fiduciary services firms, accountants, lawyers and tax advisors. Singapore and Hong Kong, for example, have been busy building structures to attract family offices, while Switzerland’s political neutrality and political stability remains a draw.
The future
Looking ahead, BCG said that it expects Switzerland, Hong Kong, and Singapore to capture nearly two-thirds of all new cross-border wealth through 2029. Switzerland will remain a top destination for clients from Western Europe and the Middle East, while Latin American investors will continue to channel most of their cross-border wealth into the US. In Asia-Pacific, Singapore and Hong Kong will lead inflows. The UAE is poised to maintain strong growth, the report said.
Totals
Global net wealth reached $512 trillion in 2024, growing by just 4.4 per cent – below the 5.3 per cent average growth recorded in the prior four years. This muted topline result masks sharper contrasts underneath. Financial wealth rose by 8.1 per cent, buoyed by momentum in global equities, while real assets fell by 0.4 per cent and liabilities grew by just 0.2 per cent, dragging down overall net wealth growth.
Wealth managers grew their AuM by 13.0 per cent, outpacing growth in overall financial wealth. They benefitted from strong exposure to high-yielding asset classes and higher growth in the high net worth segments relative to mass and affluent investors.
However, wealth managers’ revenue didn’t keep pace, rising by 7.1 per cent. As a result, revenue per AuM slipped slightly. Even so, many firms reduced costs in parallel, helping to maintain a steady cost-to-income ratio of 75 per cent.
North America was the strongest engine of financial wealth creation in 2024, expanding by 14.9 per cent – propelled by a 23 per cent rise in the S&P 500. Asia-Pacific followed with 7.3 per cent growth, supported by robust performance in China, India, and ASEAN economies. In contrast, Western Europe lagged, posting just 0.8 per cent growth, partly caused by the fall of major currencies against the dollar.
Looking ahead, Asia-Pacific is forecast to lead global financial wealth expansion, with projected growth of about 9 per cent annually through 2029 – ahead of North America (4 per cent) and Western Europe (5 per cent).
Organic challenge, and universal bank advantage
The BCG report identified a “critical weakness” – slow organic growth in AuM. It also found that universal banks perform more strongly than “pure-play” firms in generating organic growth.
“The forces that powered asset growth over the past decade are shifting. Bull markets have softened. M&A integrations remain complex and costly. And firms that once expanded by hiring seasoned advisors and absorbing their books are now confronting diminishing returns: experienced advisors are in short supply, and nearly half of new hires fail to deliver their initially-agreed business case. As a result, organic growth matters more than ever.
“Yet many wealth managers are struggling to raise it. As one senior executive told BCG, "More than 80 per cent of our net new assets over the last five years came from newly-hired advisors – not from the teams already in place.’
“Organic growth accounted for only a small share of total asset growth over the past decade. Yes, wealth managers have made progress on efficiency. Global cost-to-income ratios fell from 78 per cent to 75 per cent on average – driven largely by the top quartile, where the average dropped from 69 per cent to 64 per cent.”
The report’s findings have implications for business models, for example universal banks covering a range of functions, versus more “pure-play” firms concentrating entirely on private banking or wealth.
“On the surface , pure plays appear to outperform, with AuM growing at close to 8 per cent annually over the last decade, slightly ahead of the 7 per cent seen at universal banks. But that topline figure hides a deeper issue. Only 15 per cent of pure-plays’ growth came from net new assets generated by existing advisors – compared with 32 per cent for universal banks."
BCG said universal banks have "built-in" advantages to help organic growth, such as internal referrals; retail banking channels; capital strength, and recognisable brands.